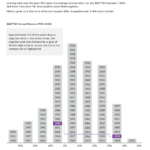
The chart below shows the historical investment returns for various indices from 1995 thru 2009:
Click to enlarge
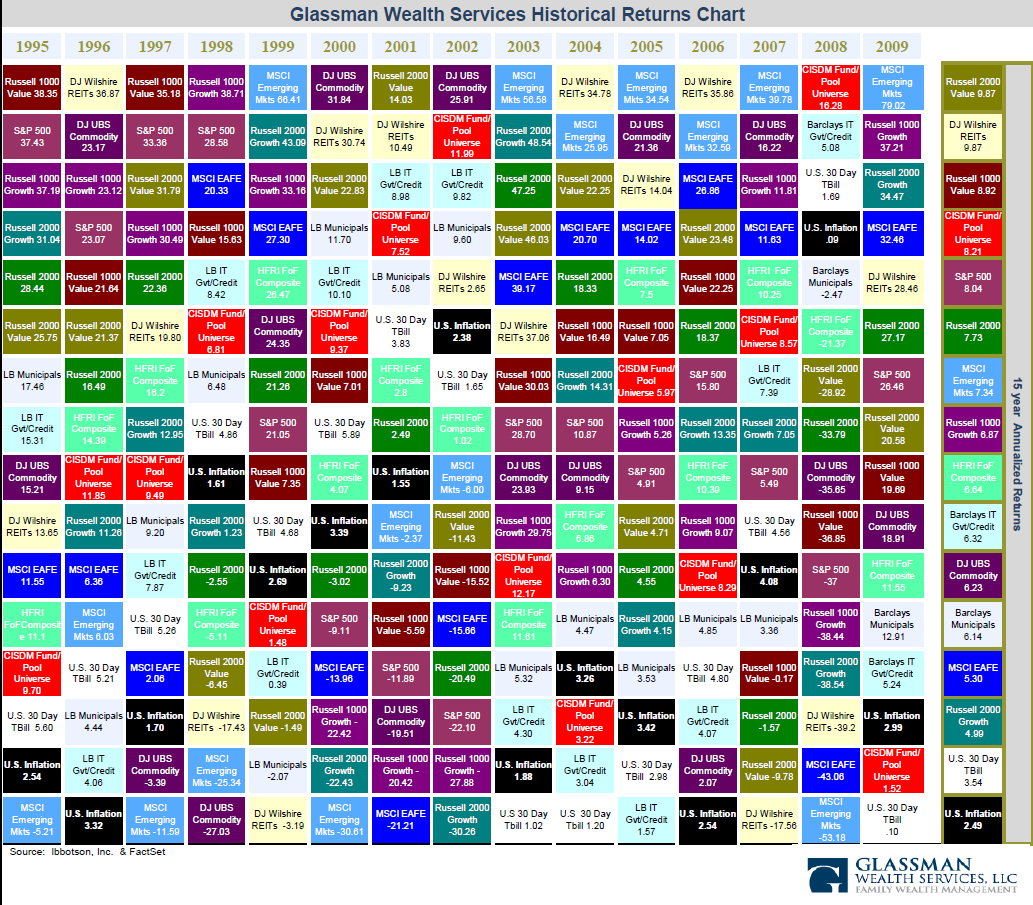
Some observations:
- Since 2003, the MSCI Emerging Markets Index has yielded double-digit returns except in 2008 when it fell 53%.
- On 15-year annualized returns basis, the small-cap Russell 2000 Index and the REIT Index have performed better than S&P 500 and the emerging market indices.
- The MSCI EAFE Index performed better than S&P 500 in the past few years except in 2008 when it was the second worst performer.
Related:
The Callan Periodic Table of Investment Returns 2009