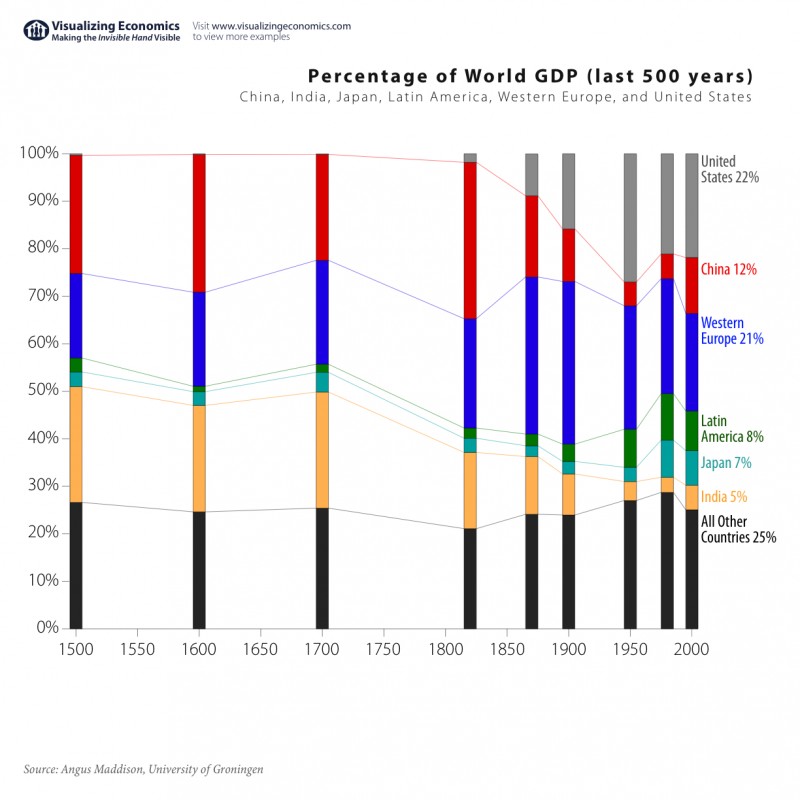
The graphic below shows the change in composition of World GDP over the last 500 years. The economy of China and India were much larger in the 16th,17th, 18th and 19th centuries than they are today.Both the economies started to shrink from the 1850s. However they are growing at an increasing pace with China’s GDP reaching 12% of global GDP in 2000 and India reaching 5%.
It is interesting to note that the U.S. economy grew dramatically from early 1800s thru 1950. As China takes a larger portion of the world’s economic growth, the US share of the global output may decline.
Click to Enlarge