The White House projected that the sharply rising U.S. government deficit could reach $9.05 Trillion over the next decade. In February, after Mr.Obama became President, the projection was around $7 Trillion. Mr.Obama inherited a gaping budget deficit from the previous Bush administration due to tax cuts.
“Still, the deficit, stemming mostly from aid to the financial system and fiscal stimulus to jolt the economy from recession, represents more than 11 per cent of gross domestic product (GDP), the largest as a share of the economy since World War II, analysts pointed out.
Under assumptions by both the White House and the CBO, the United States will consistently run up large deficits of around three to four per cent of GDP.”
In a New York Times Op-Ed, Professor Paul Krugman says “deficits saved the world.” He added:
“But what about all that debt we’re incurring? That’s a bad thing, but it’s important to have some perspective. Economists normally assess the sustainability of debt by looking at the ratio of debt to G.D.P. And while $9 trillion is a huge sum, we also have a huge economy, which means that things aren’t as scary as you might think.
Here’s one way to look at it: We’re looking at a rise in the debt/G.D.P. ratio of about 40 percentage points. The real interest on that additional debt (you want to subtract off inflation) will probably be around 1 percent of G.D.P., or 5 percent of federal revenue. That doesn’t sound like an overwhelming burden.
Now, this assumes that the U.S. government’s credit will remain good so that it’s able to borrow at relatively low interest rates. So far, that’s still true. Despite the prospect of big deficits, the government is able to borrow money long term at an interest rate of less than 3.5 percent, which is low by historical standards. People making bets with real money don’t seem to be worried about U.S. solvency.”
An article titled Paying the Piper by Carlo Cottarelli in the IMF’s “Finance and Development” magazine March edition mentioned that “the increase in government debt (as a share of GDP) in advanced economies is projected to be the largest and most pervasive since World War II” due to all the financial sector rescues. The rise in debt-to-GDP ratios is projected at 14.5% of GDP for the G-20 economies, half of which is due to rescue packages offered to the financial sector.
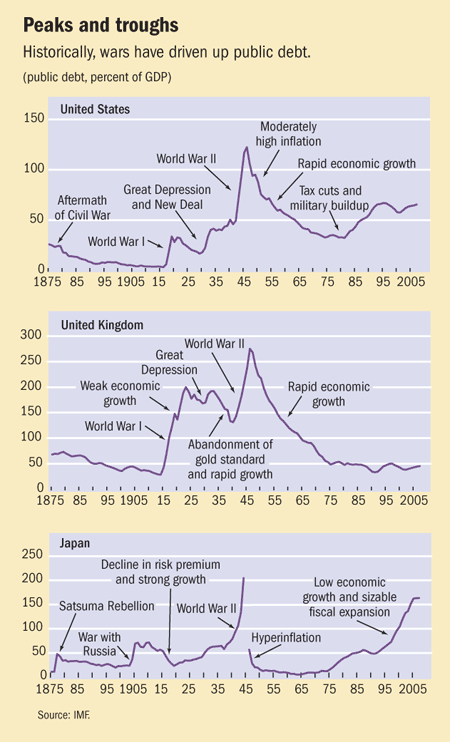
Though today’s debt-to-GDP ratios is high, even higher ratios were observed in the past especially during World Wars I and II. After the wars economic growth helped reduce the large debt accumulated to low levels. The chart below shows the growth of debt in the past for three major economies: the US, UK and Japan.
Strong economic recovery is critical to debt reductions.The IMF article noted:
“For example, rapid economic growth following World War II reduced the debt-to-GDP ratio in the United States from 121 percent in 1946 to 50 percent in 1965. In contrast, with overly prudent fiscal policies and continued compliance with the gold standard, sluggish economic growth in the 1920s and during the Great Depression led the debt-to-GDP ratio to rise in the United Kingdom from 130 percent in 1919 to 178 percent in 1933.”
Economists are projecting that the current US economic recovery will be sluggish and that private consumption will remain flat to down for many years. In addition to the many bailouts of the financial sector which added billions to the nation debt, the U.S. is now engaged in two wars in Iraq and Afghanistan.If the US loses its AAA credit rating and the economy remains in stagflation mode for many years, then the huge U.S. debt would lead to many problems. Some consider the AAA rating of the U.S. is at risk already. However as long as the Chinese and other friendly governments are willing to “pay the piper” we are in good shape. Would you agree?
Related item: A Brief History of The U.S. Deficit (Time)


