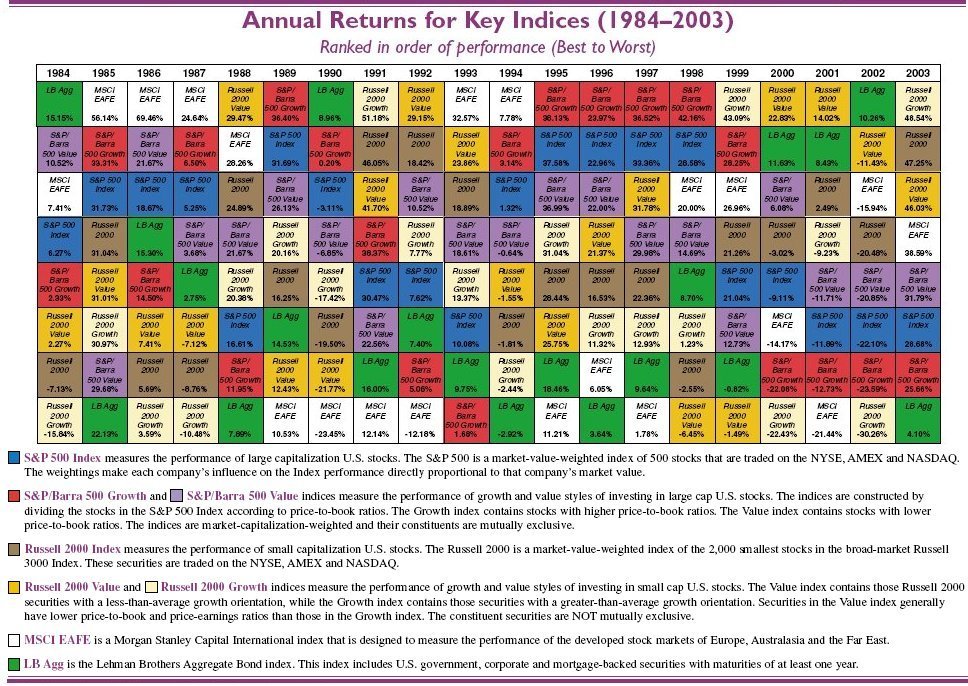
The Callan Periodic Table of Investment Returns from Callan Associates is widely used by investors to compare performance of various market indices. Recently I found the Callan Chart that lists the Best and Worst Performing Indices from 1985 to 2004. To access this chart click on the image below:Callan Chart Annual Returns – The Best and Worst Performing Indices from 1985 to 2004:
Click to Enlarge

Related Charts:
1. For Top 10 Emerging Markets in 2008,
The Top 5 Best and Worst Performing Countries Chart
Go here.
2. For The Callan Periodic Table of Investment Returns for 2008 click here.
3. For The Callan Period Table of Investment Returns (1988-2007),
Callan’s – Equity Return of Developed Markets Chart
Go here.
4. The Callan Period Table of Investment Returns (1983-2002)
Click to Enlarge
5. The Callan Period Table of Investment Returns (1984-2003)
Click to Enlarge