Each year investors eagerly await the release of the Global Investment Returns Yearbook by London School of Business (LBS). This year’s yearbook was sponsored by Credit Suisse Research Institute and the researchers were Elroy Dimson, Paul Marsh and Mike Staunton of LBS. The authors urge investors to keep the faith with equities.
What is the Global Investment Return Yearbook?
“The Yearbook is a comprehensive and authoritative analysis of total returns since 1900 for stocks, bonds, cash, foreign exchange and inflation in 17 national stock markets and three worldwide indexes, covering Europe, North America, Asia, and Africa.”
The following are excerpts from the Yearbook for 2009:
- When the stock equities bottomed last November, investors worldwide had lost a whopping $21 Trillion
- Equities were the best performing asset class in every 17 country since 1900
- In the 17 countries real return of equities was between 3% to 6% per year
- For investors the last decade has been the lost decade
- Overall the long run(1900-2008), investors get rewards for the higher risk of investing in stocks. We can infer this from the Figure 1 below. The grey bars indicate the returns during the boom years of the 1990s.

- A $1 invested in US stocks in 1900 would have grown to $14,276 by the end of 2008 for an annualized yield of 9.2%. Taking the consumer price rises into consideration this would equal to a real return of 6.0%. For the same period, bonds returned 2.1%.
- After World War II, the equities of the defeated countries of Germany and Japan were crushed with returns of -88% and -96% respectively
- Between 1949 and 1959 stocks rose by 516% in real returns
- For the decade after World War I, equities returned 206%
- In the economic miracle years after the end of WW II, Japanese and German equities returned 29.1% and 40.4% per year
Chart – Real Returns of US Asset Classes during the four “Golden Ages”:
(click to enlarge)

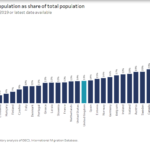
- South Africa, Sweden and Australia equities topped US equity performance since 1900 as shown below

Table – Individual Country Equity Real Returns since 1900s:
[TABLE=136]
There are much more fascinating details in the Global Investment Returns Yearbook 2009. To download the full report click here. (file opens in pdf)
For the 2008 Global Investment Returns Yearbook go here.(file opens in pdf)
Source: Credit Suisse Research Institute