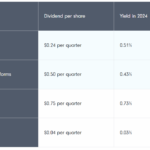
There are many ways to evaluate a bank stock. Bank stocks usually pay dividends. In fact many banks have high yields and usually are grouped together with other dividend paying stocks such as Utilities, REITs etc. In this post, lets look at one way to analyze banks. In later posts, we will discuss different methods to determine whether a stock is over-priced or cheap.
Banks publish many financial measures in their reports.Out those there are some factors which are very important to review before making an investment decision.
One way to analyze a bank is to review the following three factors:
1. Reserves for Loan Losses
2. Non Performing Loans
3. Capital Levels.
Definition of terms
1.Reserves for Loan Losses:
Banks expect some of the loans to go bad. To meet these loan losses by regulation they are required to maintain some reserves. This reserve amount allocation is based on the judgment of the bank’s management at the time the reserve is made. The reserve can rise (or) fall depending on the performance of the loan portfolio. usually this reserve amount will be between 0.9% to 5% of a bank’s total loans outstanding. The lesser thisratio the better the bank.
Another term to this factor is “Provision for Loan Losses” or “Provision for Credit Losses”.
2.NonPerforming Loans
This is basically the level of loans which are not performing anymore – meaning that interest income is not being collected by the bank and the repayment of principal is either rescheduled for payment later or may not be paid at all. A high level of this factor indicates that the bank’s loan portfolio is not good.This measure usually can go anywhere from 0.5% of total loans. If it exceeds 3% then the bank may be in serious trouble.
This can also be called as “Impaired Loans” or “Gross Impaired Loans”
3.Capital Levels
By law banks have to maintain some capital to continue operations. A bank cannot have assets of $1M and issue loans totalling $990M. Banks with higher capital levels are conservative and hence better than less capital holding ones. A bank with high capital levels can grow easily since it will more money to spend on acquisitions, expansion plans etc.
Nowadays banks call this ratio as the “Tier 1 Capital” ratio.Simply put, it shows the strength of a bank.
Explanation
1.Reserves for Loan Losses – Some Examples:
You can find this factor in the “income Statement” of banks. For eg. – Bank of Montreal (BMO) had the following ratios:
Year 2004 – (0.07)%
Year 2005 – 0.11%
Year 2006 – 0.09%
The figures show that it increased from 2004 to 2005 a lot. But decreased slightly by 0.02% in 2006 which is good. So here the ratios never went above 1% let alone the max. of 5% as defined in the definition part above.
Similarly for Bank for Novo Scotia (BNS) the ratios were as follows:
Year 2004 – 0.27%
Year 2005 – 0.14%
Year 2006 – 0.13%
Again here also the figures are below 1%.
Because BNS and BMO have held the ratios at decent levels over the past few years their stock is now doing ok when compared with many other stocks.
As a sample lets look at how one bank in the US went from bad to worse in the past few months. Macatawa Bank (MCBC) is a tiny bank in Holland,Michigan. It had the following numbers:
Year 2007: $875,000 (1.38%)
Year 2008: $2.7 Mil.(1.81%)
Year 2008 had a huge increase compared to 2006.So due to this and other factors, the MCBC stock has fallen from over $20 to < $8 today.No surprise there.
2.NonPerforming Loans – Some Examples:
For BMO, the nonperforming loans ratios were as follows:
Yr 2004: 0.71%
Yr 2005: 0.46%
Yr 2006: 0.35%
BNS had the following ratios:
Yr 2004: 0.49%
Yr 2005: 0.34%
Yr 2006: 0.24%
Both BNS and BMO have been improving their NPL ratio from 2004.They have kept it below the stated 0.5% except BMO in 2004.
3.Capital Level (Tier 1 Capital ratio) – Some Examples:
To repeat, if this ratio is higher the bank is better when compared with others.Usually factors near 10% are desirable.
For BMO the Tier 1 Capital ratios were:
Yr 2004: 9.84%
Yr 2005: 10.30%
Yr 2006: 10.22%
For BNS the Tier 1 Capital ratios were:
Yr 2004: 11.50%
Yr 2005: 11.10%
Yr 2006: 10.20%
Overall both the banks were well capitalized in the years specified.
Note: Data for 2007 and 2008 will be added in future updates to this article.
In Conclusion:
Since BNS and BMO had average to above average numbers for the three financial measures their stock have held pretty well as opposed to many US bank stocks which have been crushed hard like NCC, FITB, CNB, CBC in recent months.